Enabling thousands of social commerce businesses across Africa to delivering faster & cheaper.
Overview
As Sendy pivoted to a more scalable and competitive logisitics solution that would lead to long term success, I was brought in to lead the research & design process for the fulfillment project. Throughout the project, I spoke to over 30 social commerce and ecommerce businesses to understand the key challenges they face in delivering their products to their customers.
Over 15 weeks we iterated on solutions to help these businesses to increase their delivery efficiency while reducing delivery cost. I was responsible for in-depth research, and end-to-end design of the Seller Experience (consigning to the warehouse, delivering for orders, tracking the orders and paying for delivery).
Platform
DeadpoolAndroidiOSMy role
Lead designer
Toolkit
Miro, Figma, Maze, Jira
Timeline
Jul - Dec 2021
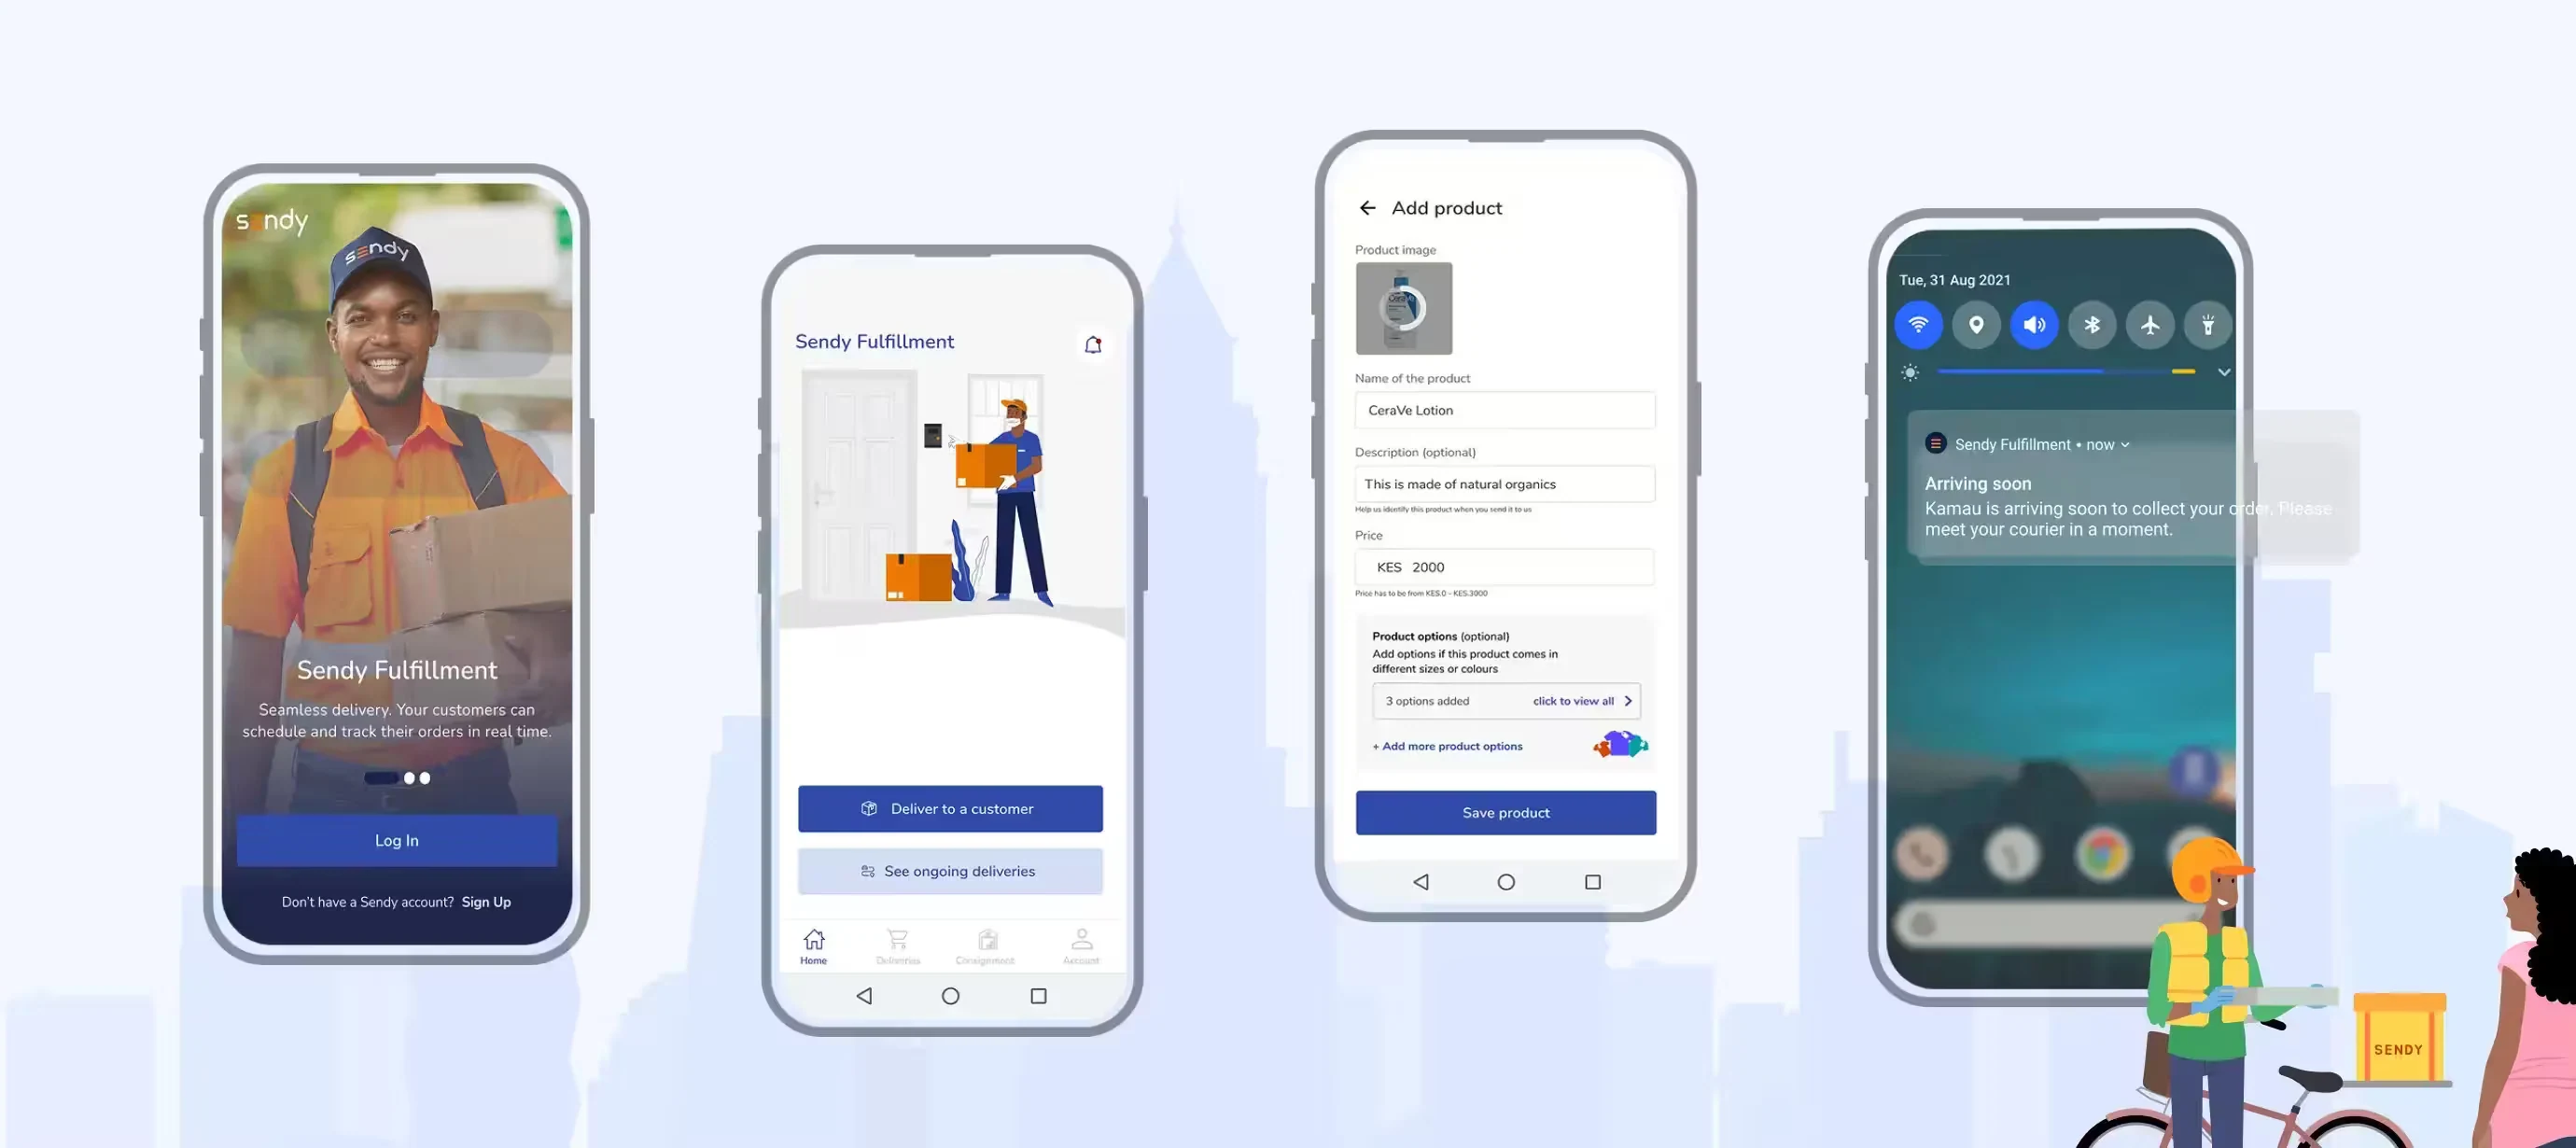
The problem
With more people in Kenya and Africa shopping for products and services online there are so many bottlenecks that exist and make this a terrible experience for millions of people. Some of the issues that stand out include payments, cost of logistics and lack of proper addressing systems.
Key opportunities
Delivery cost : The average delivery cost for items under KES 1000 is Kshs 250-600, which is prohibitively expensive for most customers and a major barrier to online business.
Lack of trust: Disagreement over payment methods—whether to pay before or on delivery—creates a standoff, with both customers and stores fearing fraud.
Lack of knowledge: Most online businesses fail due to a lack of knowledge in key areas like digital marketing, inventory management, and financial planning.
Understanding the landscape
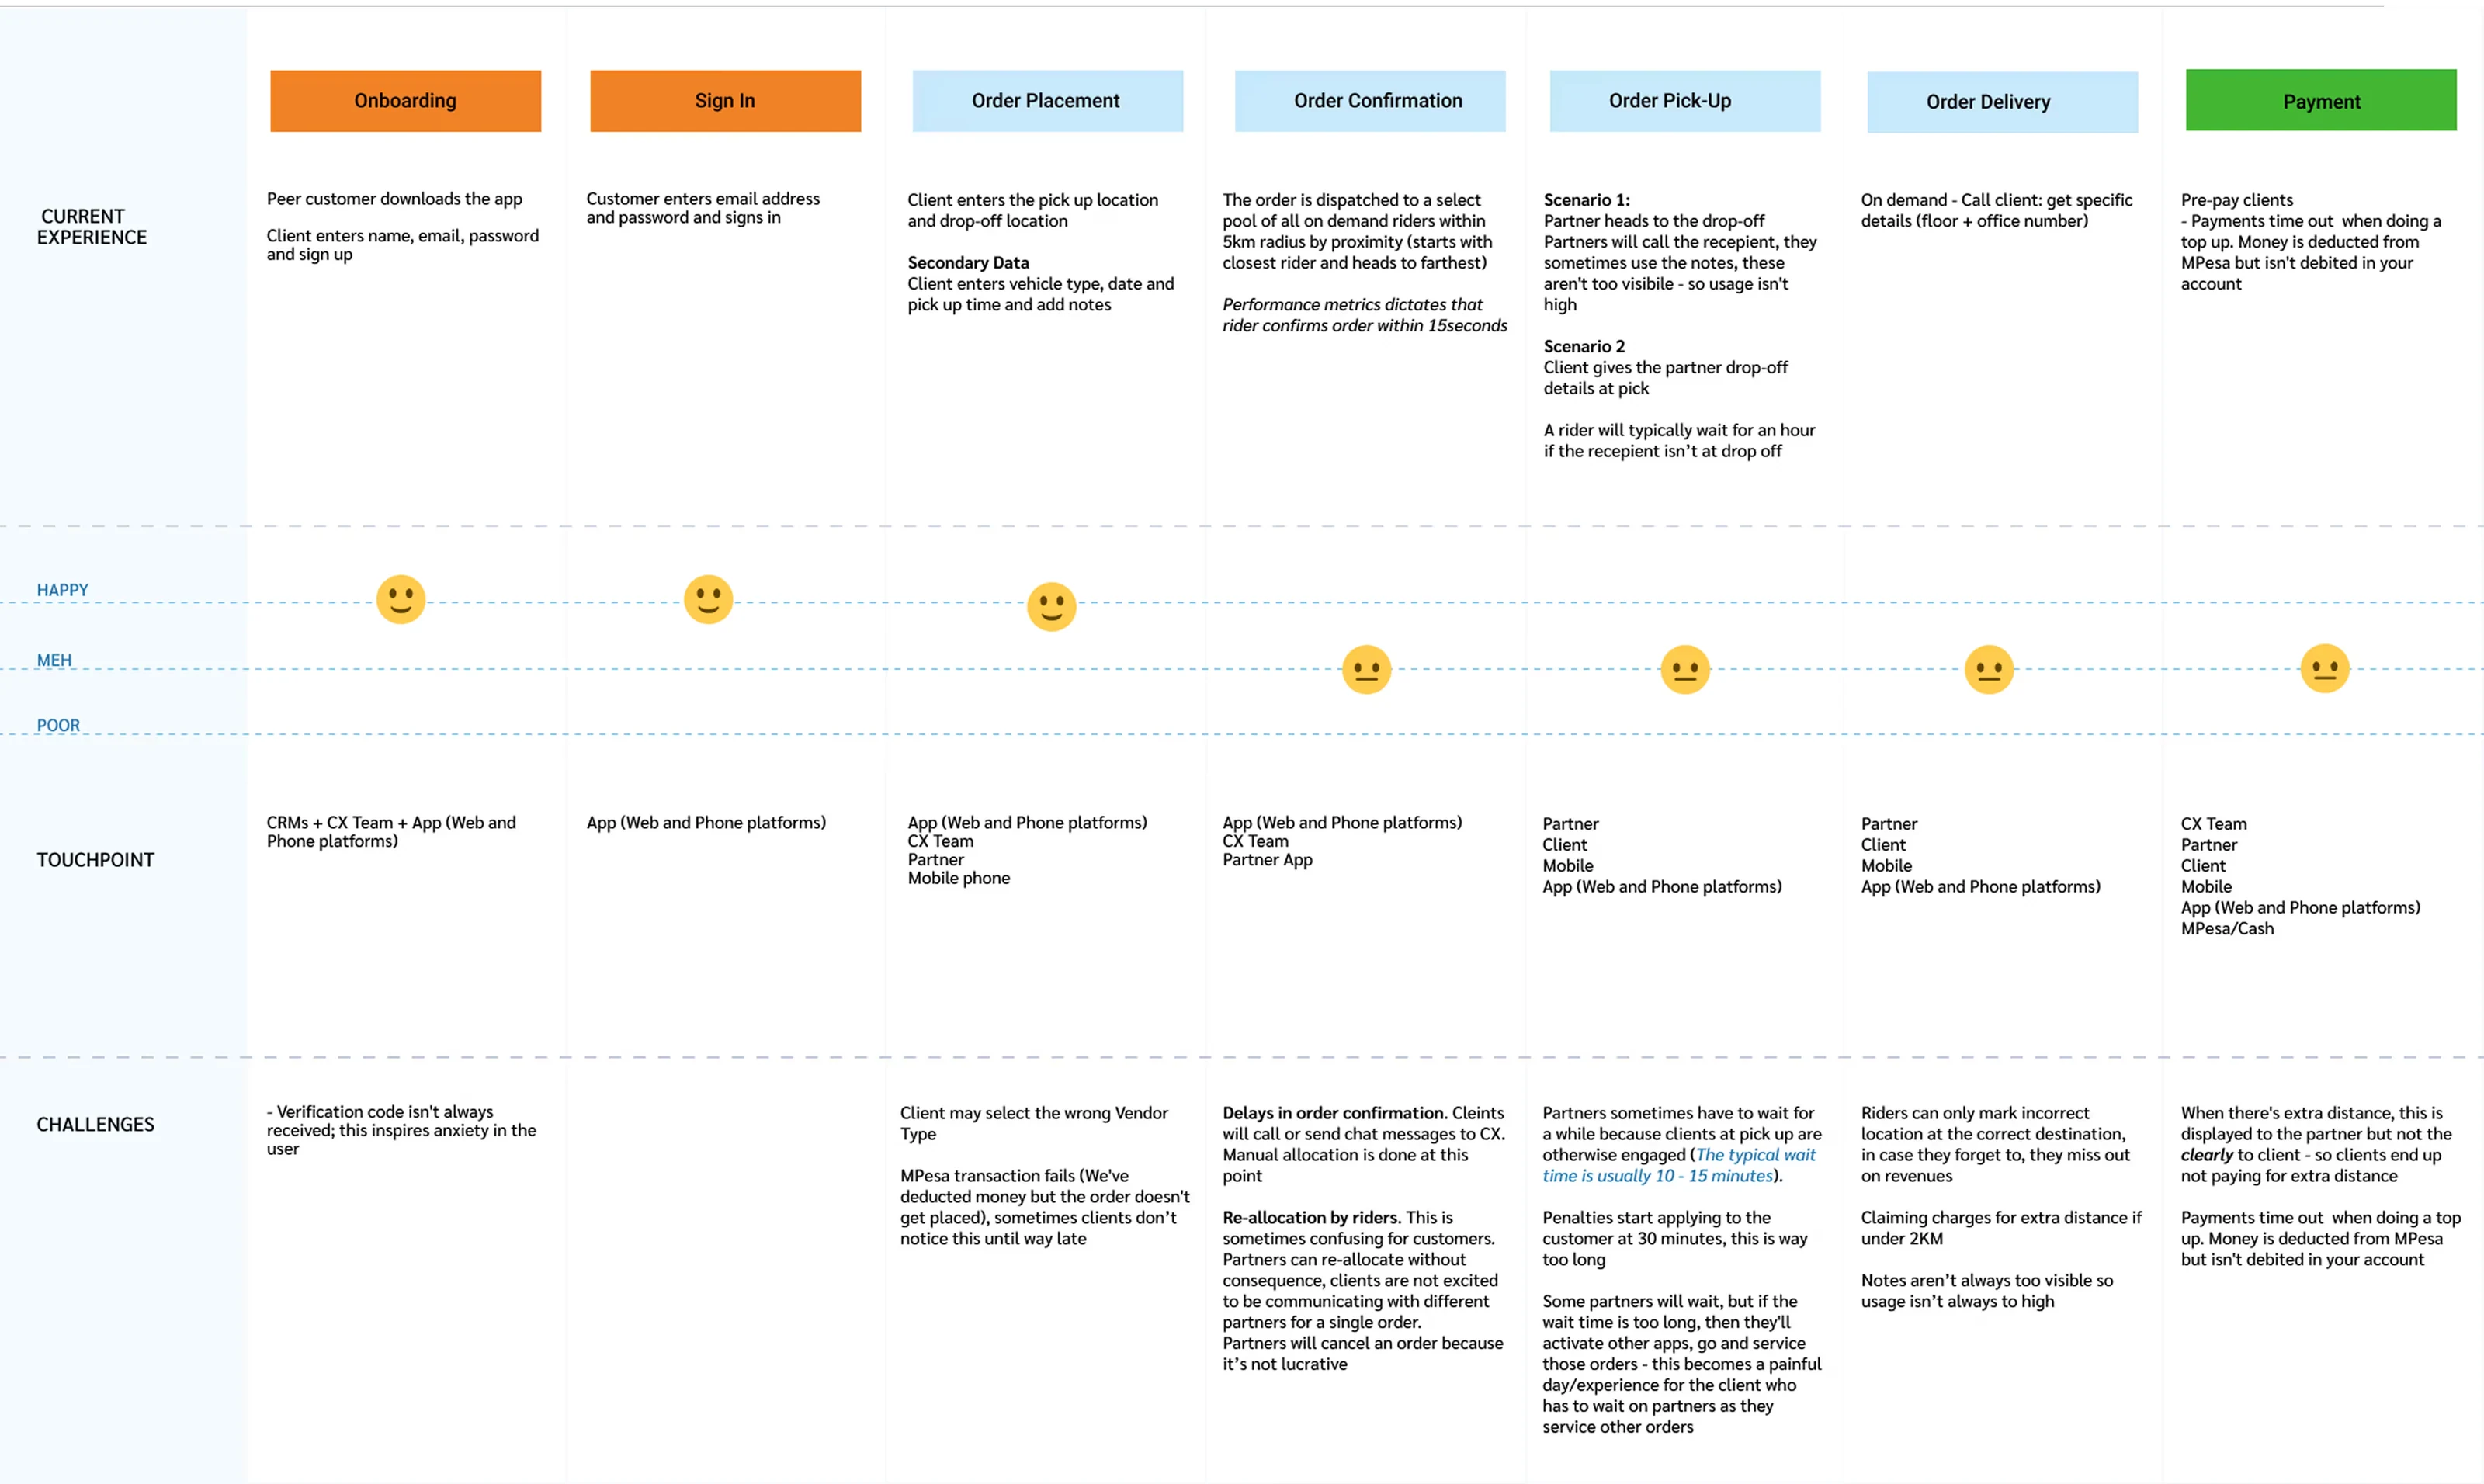
Market research helped us in determining the viability of this new service by talking directly with potential customers. We also got to discover more gaps and opportunities. We were also able to create a rapport with businesses that were willing to be part of the design process and also early adopters.
■ Research objectives
• Understand customer needs, challenges, and current workarounds.
• Identify competitive solutions and gaps in the marketplace.
• Build relationships to uncover deeper insights and opportunities.
■ Methods
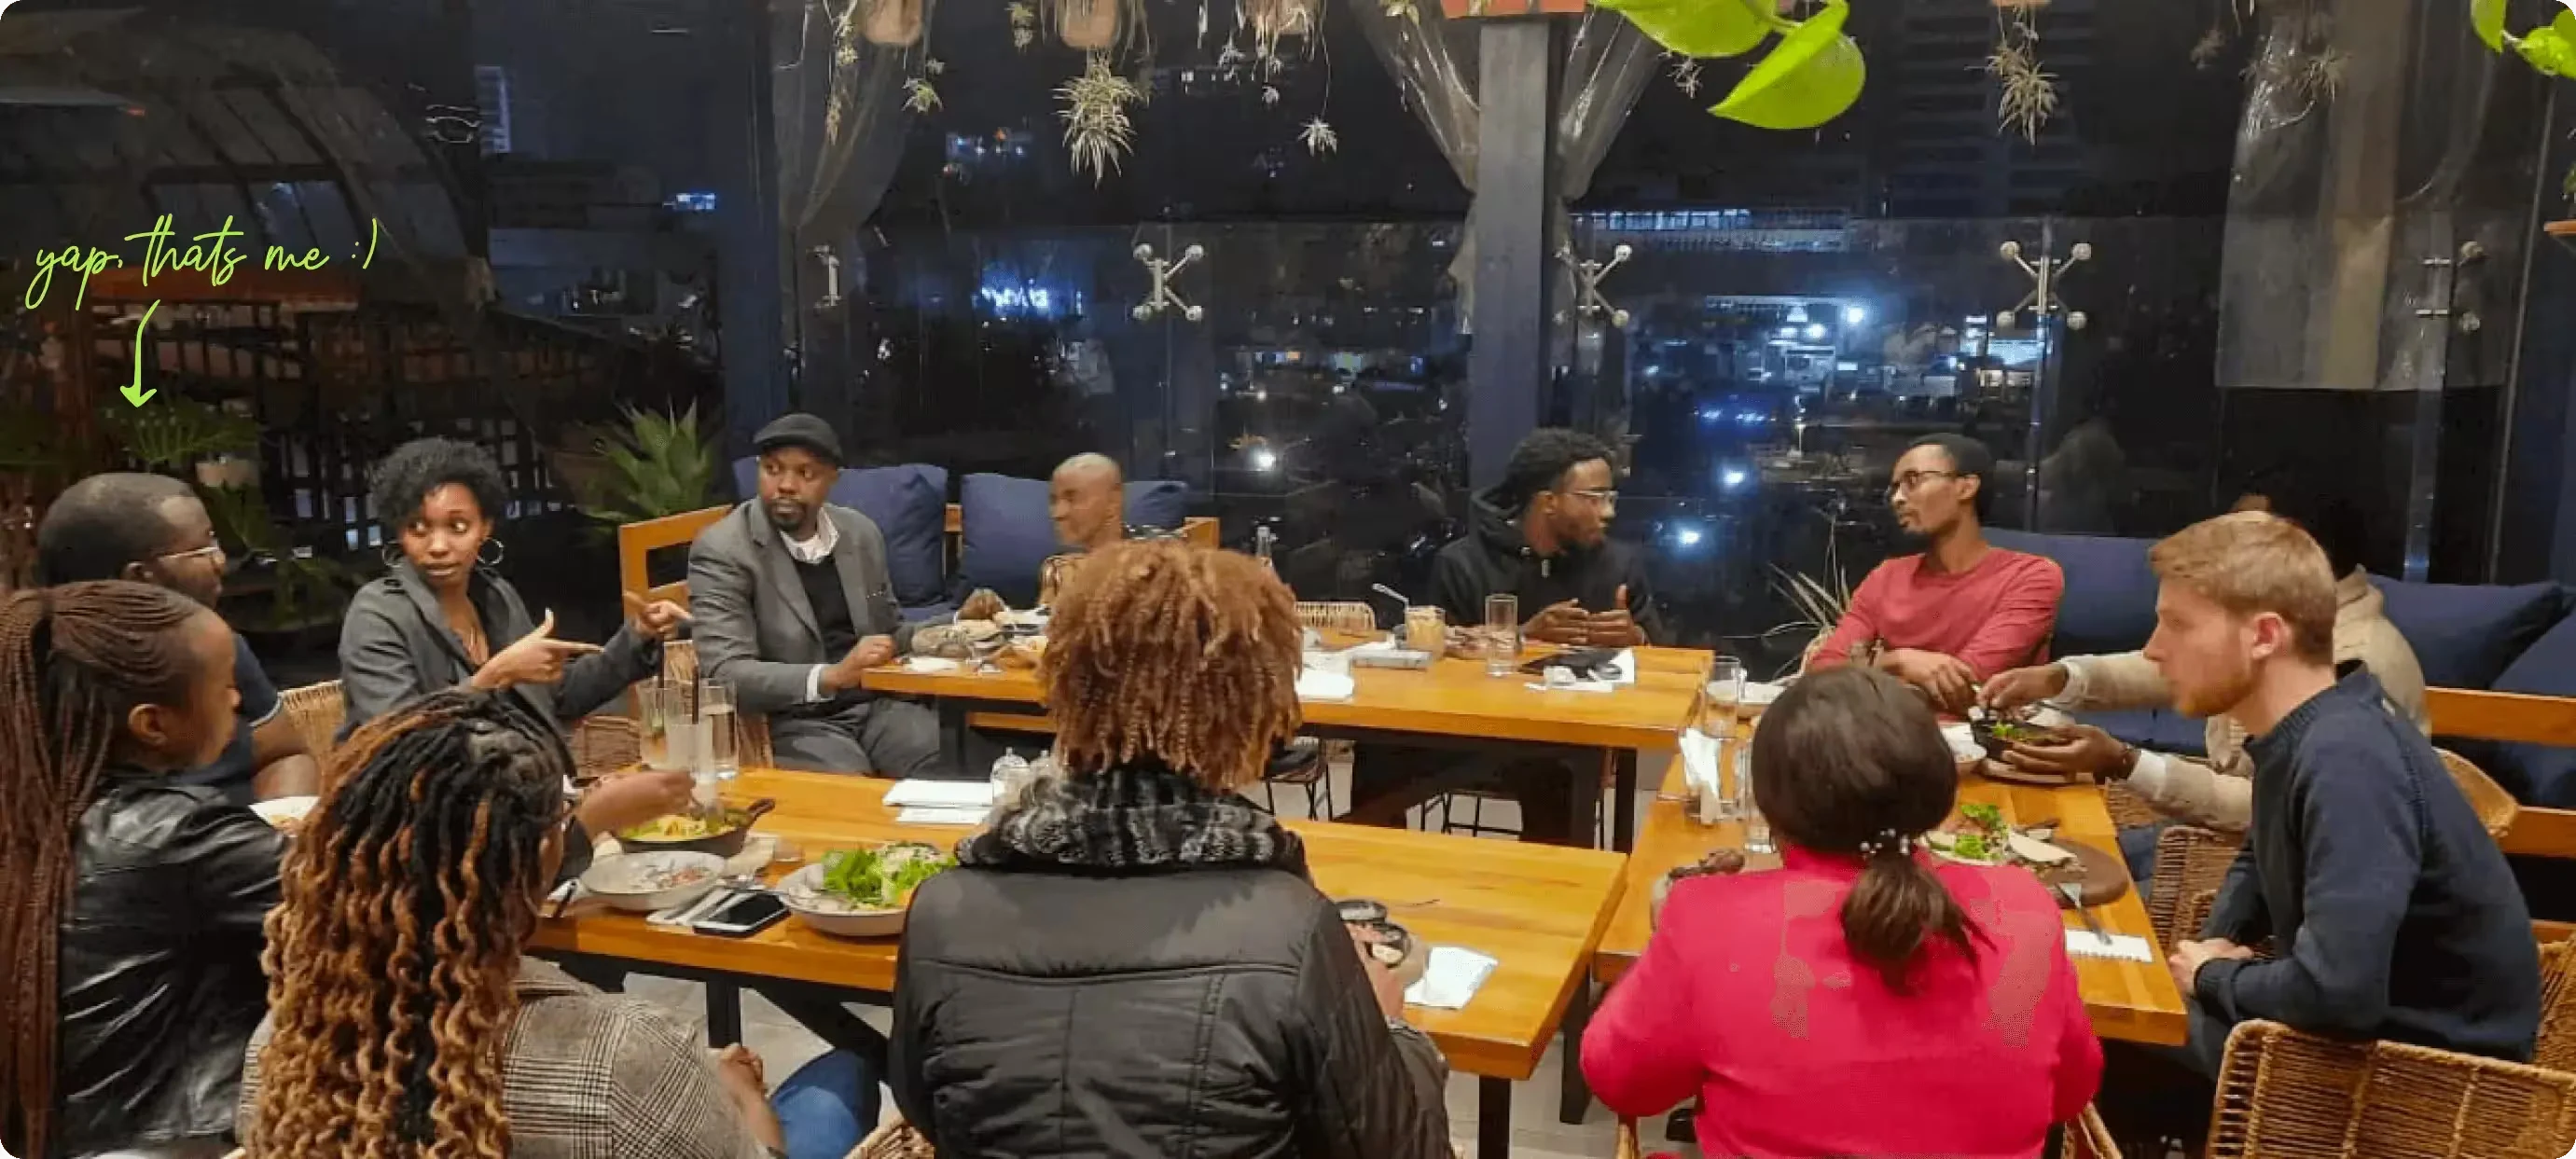
• 1 : 1 interviews - I held 18 interviews with businesses, delivery partners, and customers.
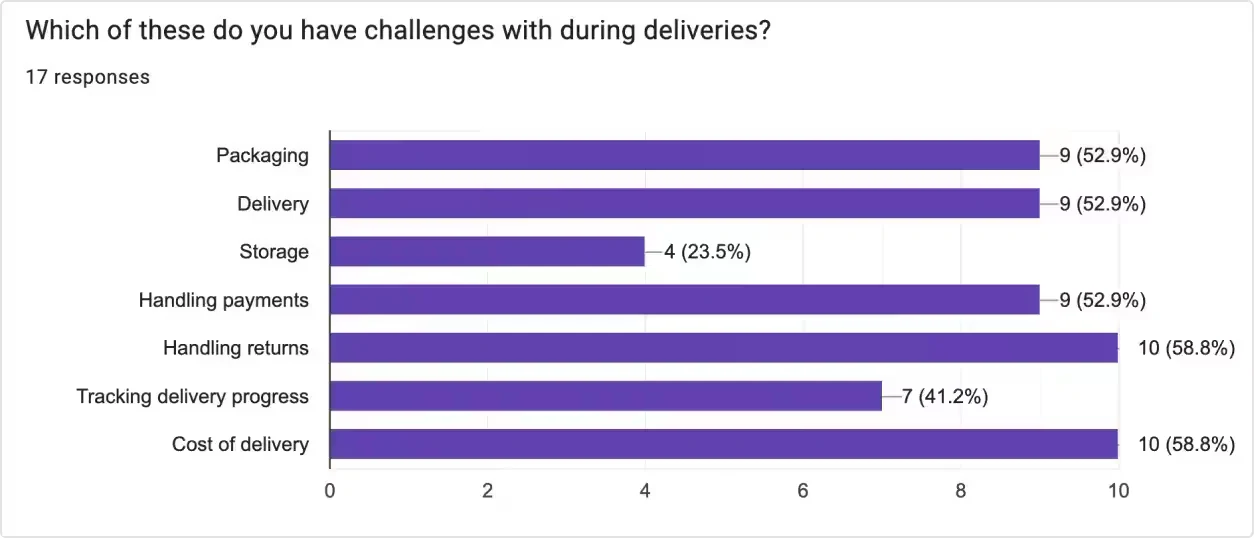
• Surveying - Helped us understand the products business customers needs and challenges.
• Assessing existing solutions - We assessed exising product offerings to map gaps.
■ Findings key themes
[1] Lowering operational cost especially for ondemand delivery.
[2] Maintaining customer relationships by providing exemplary service.
[3] Access to secure reliable, insured and affordable warehousing.
[4] Access to wider market reach means more customers
How might we reduce the cost, time and risk of package delivery for online businesses?
Exploring solutions through a moodboard and low fidelity flow enabled us to visualize the order creation process and we began aligning with stakeholders. Stakeholders and team members reviewed the wireframes and gave us constructive feedback on opportunities for improvement. This helped us identify potential issues early, significantly reducing the time we could've spent on revisions later in the process.
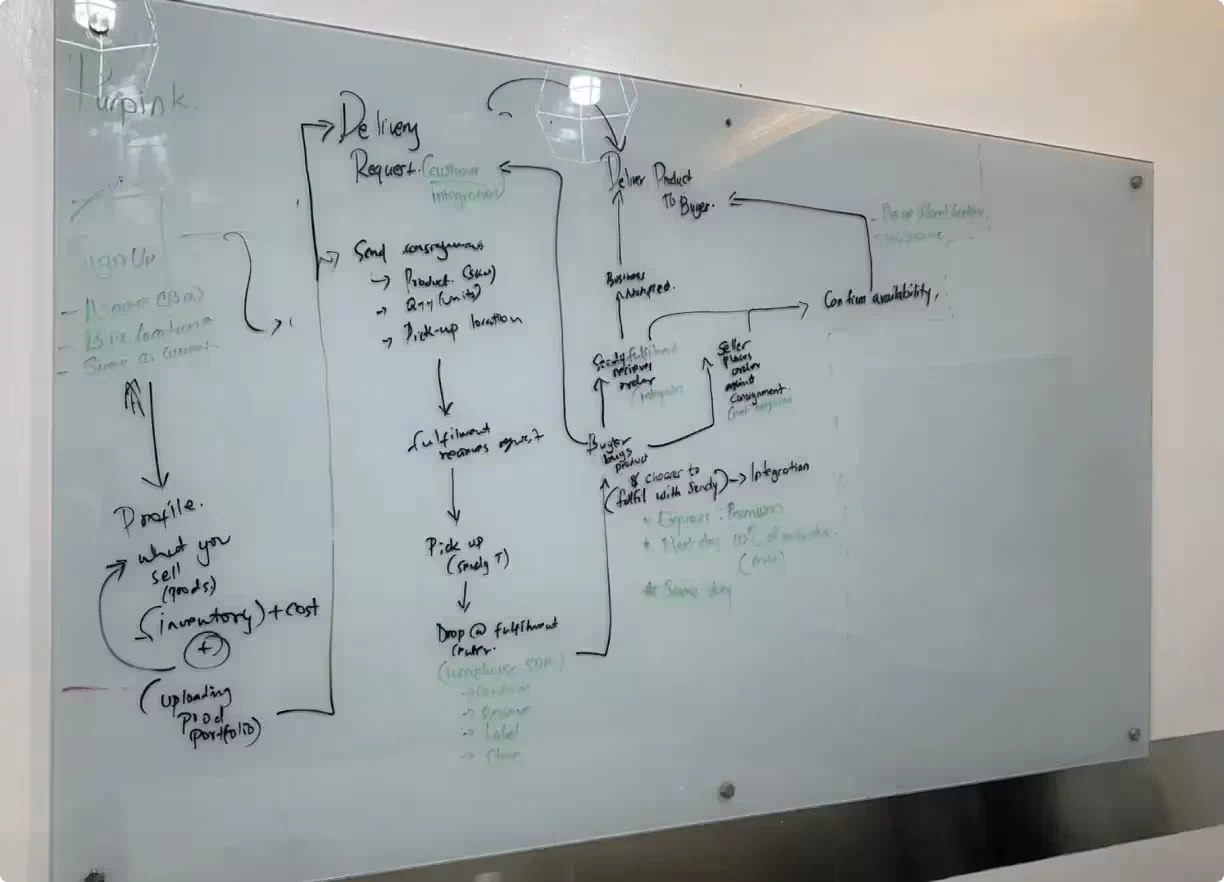
Where does delivery fit in business operations
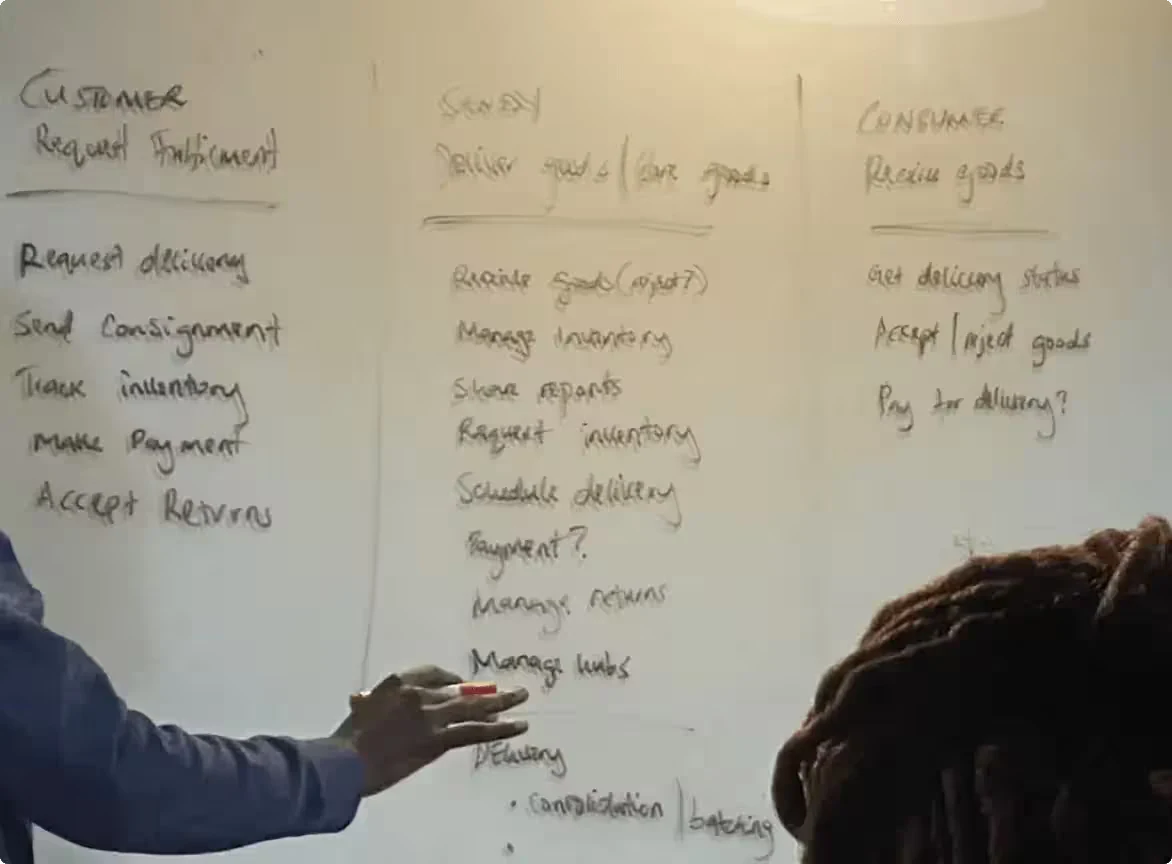
Defining roles of each party in the delivery process
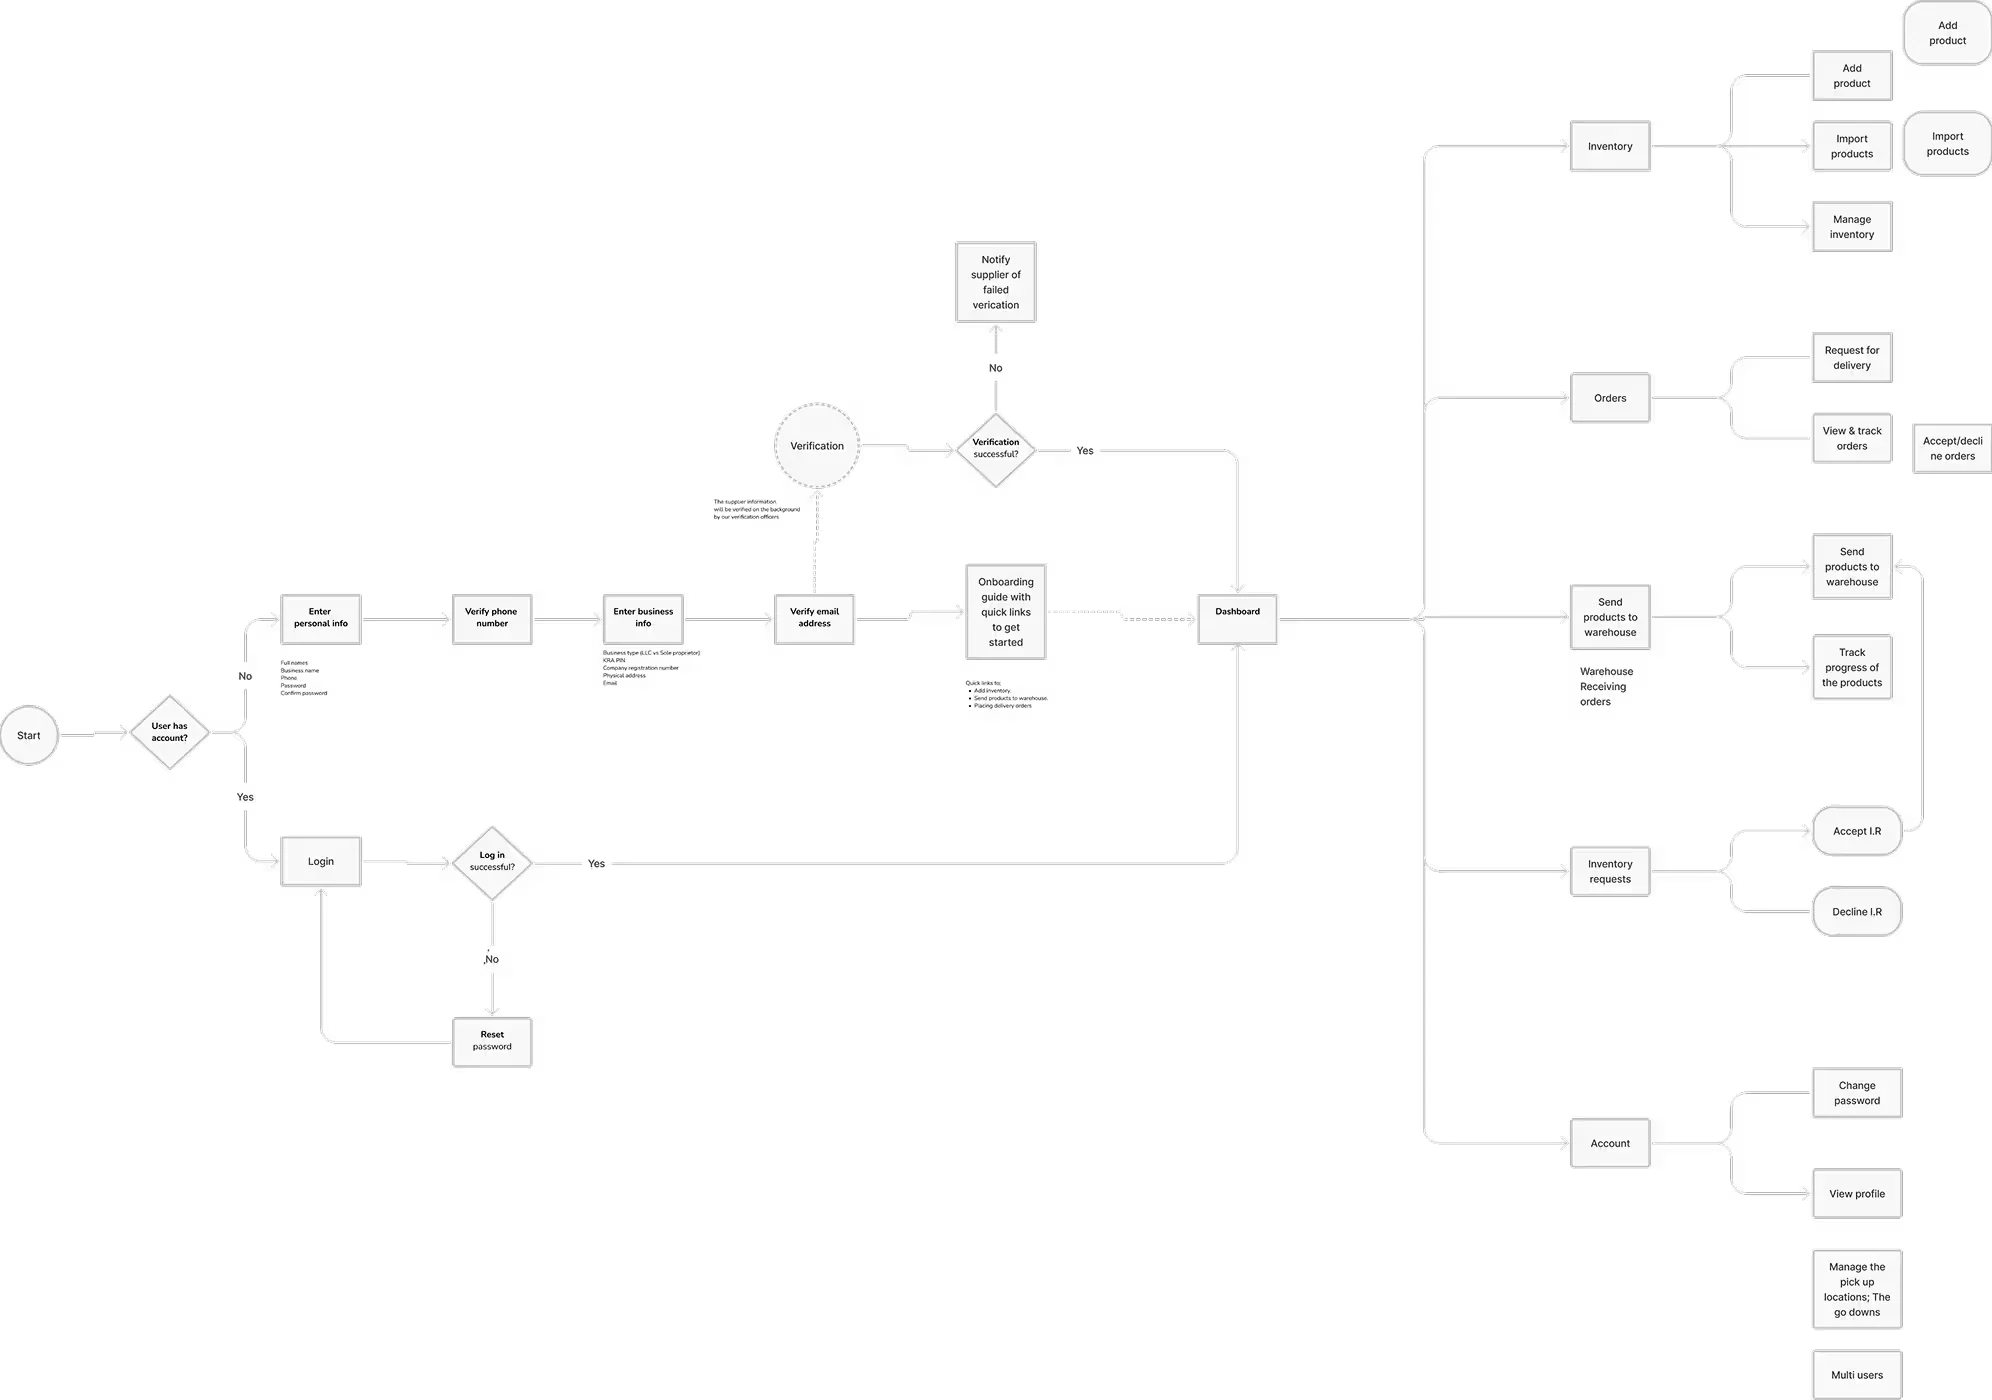
Information architecture
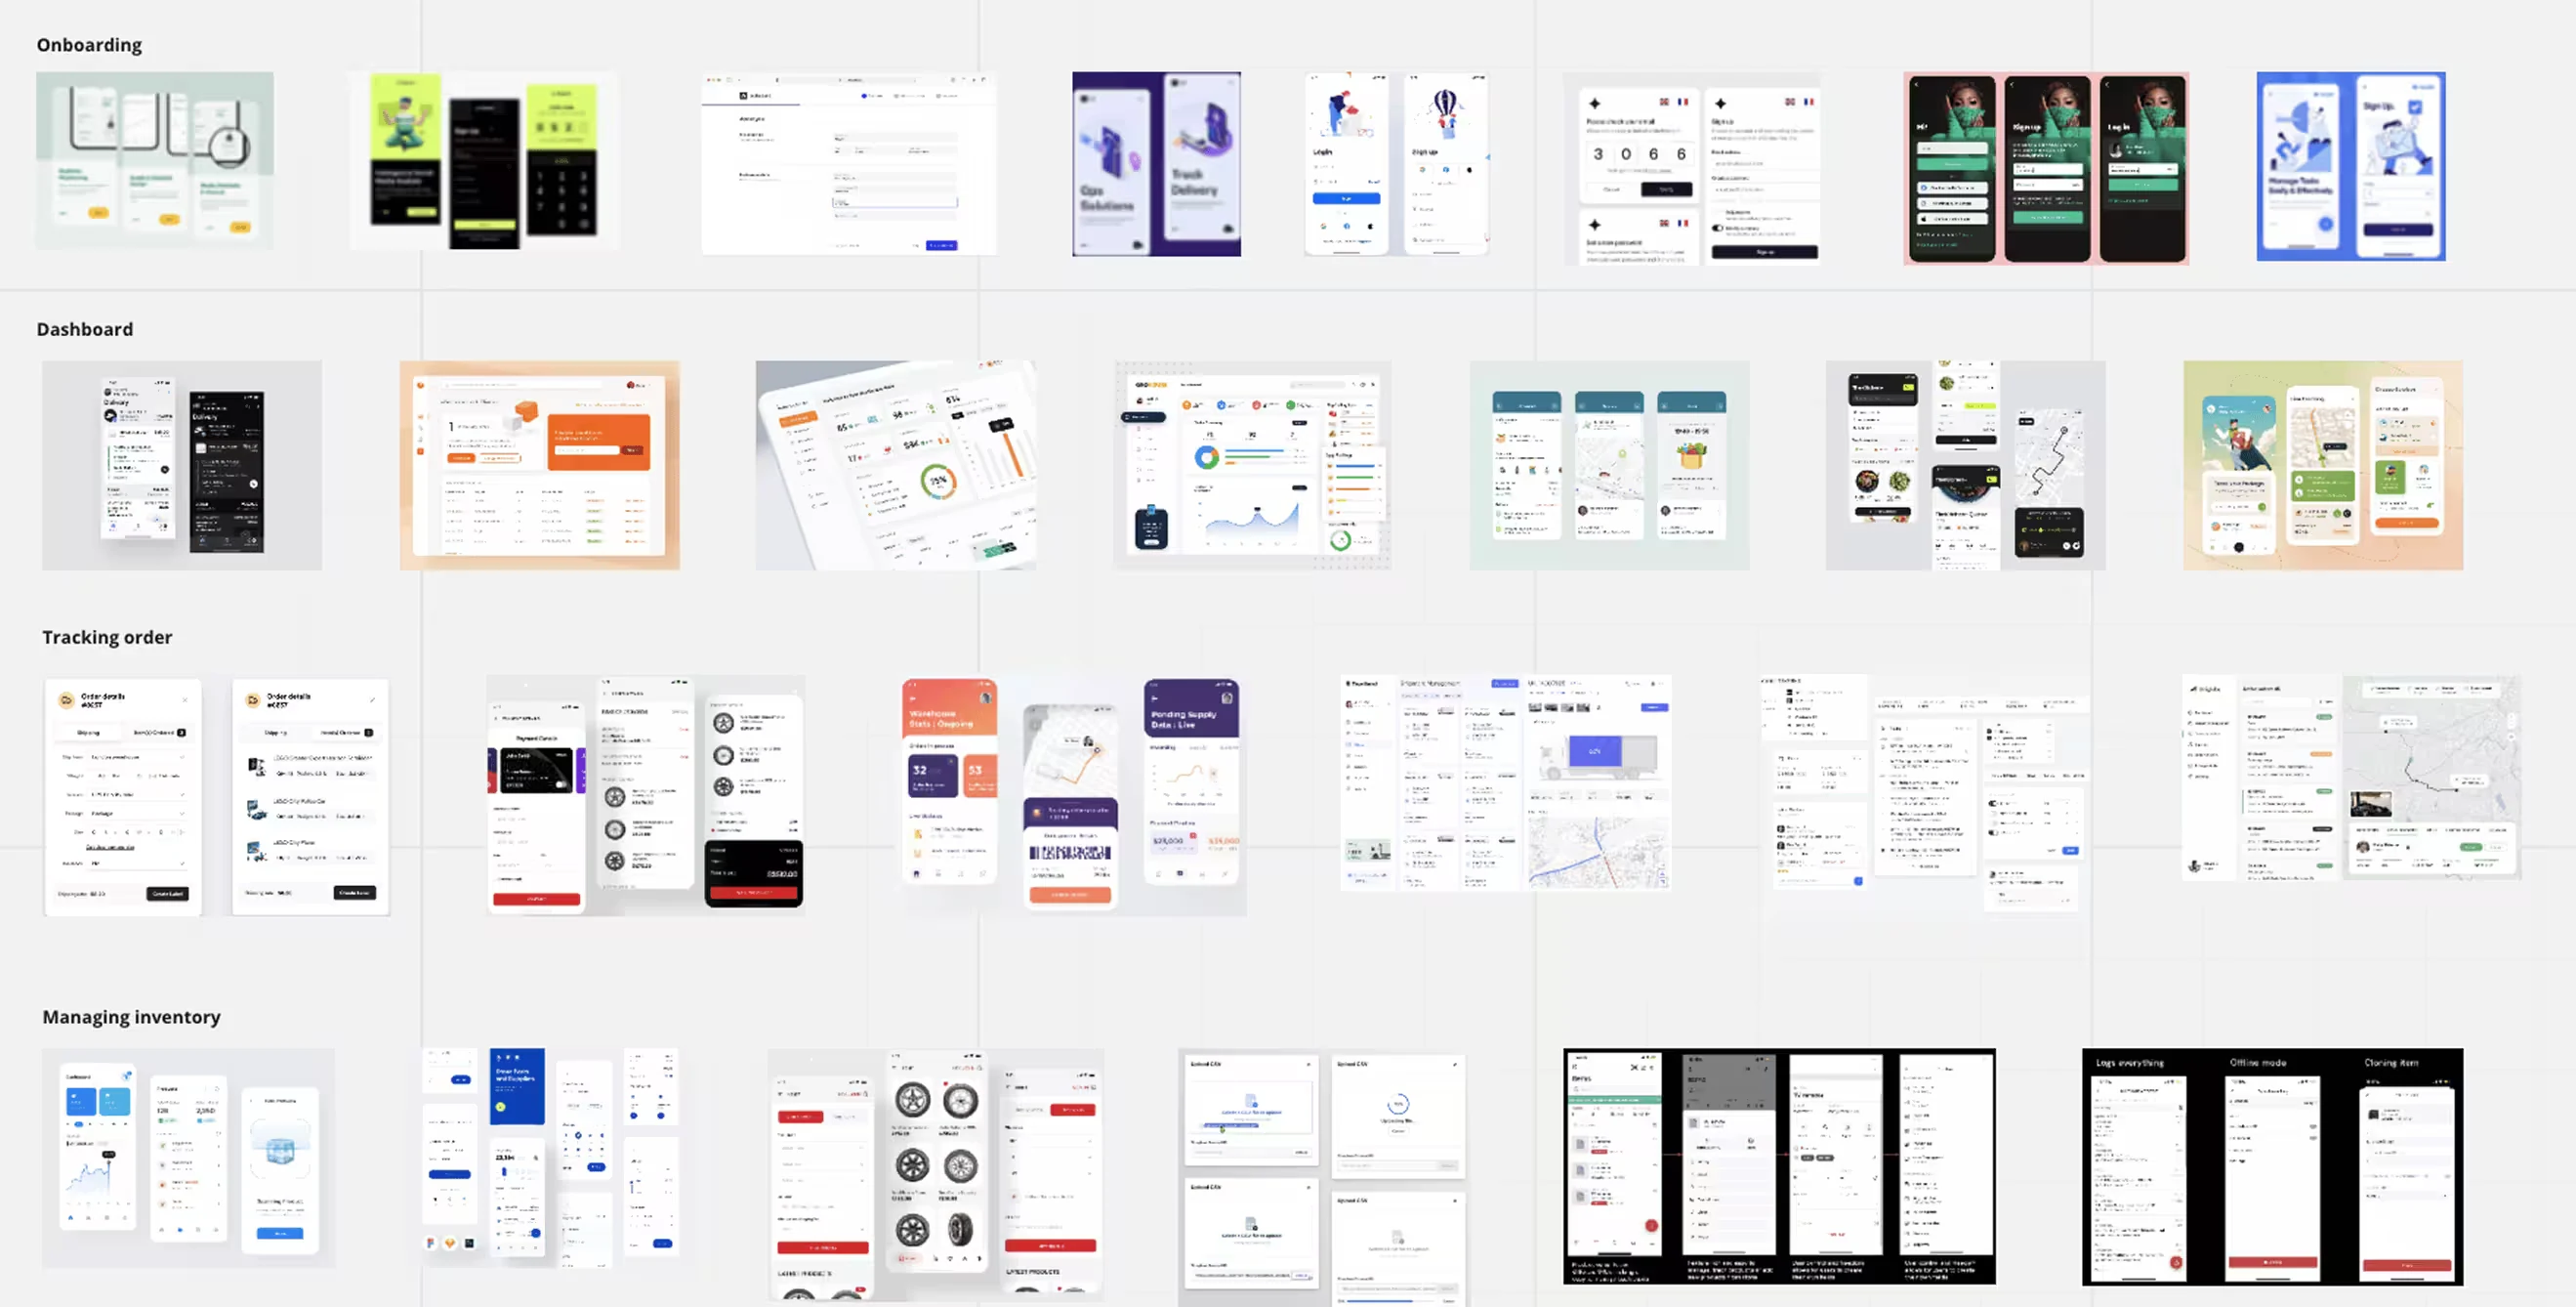
Moodboarding
Seller onboarding
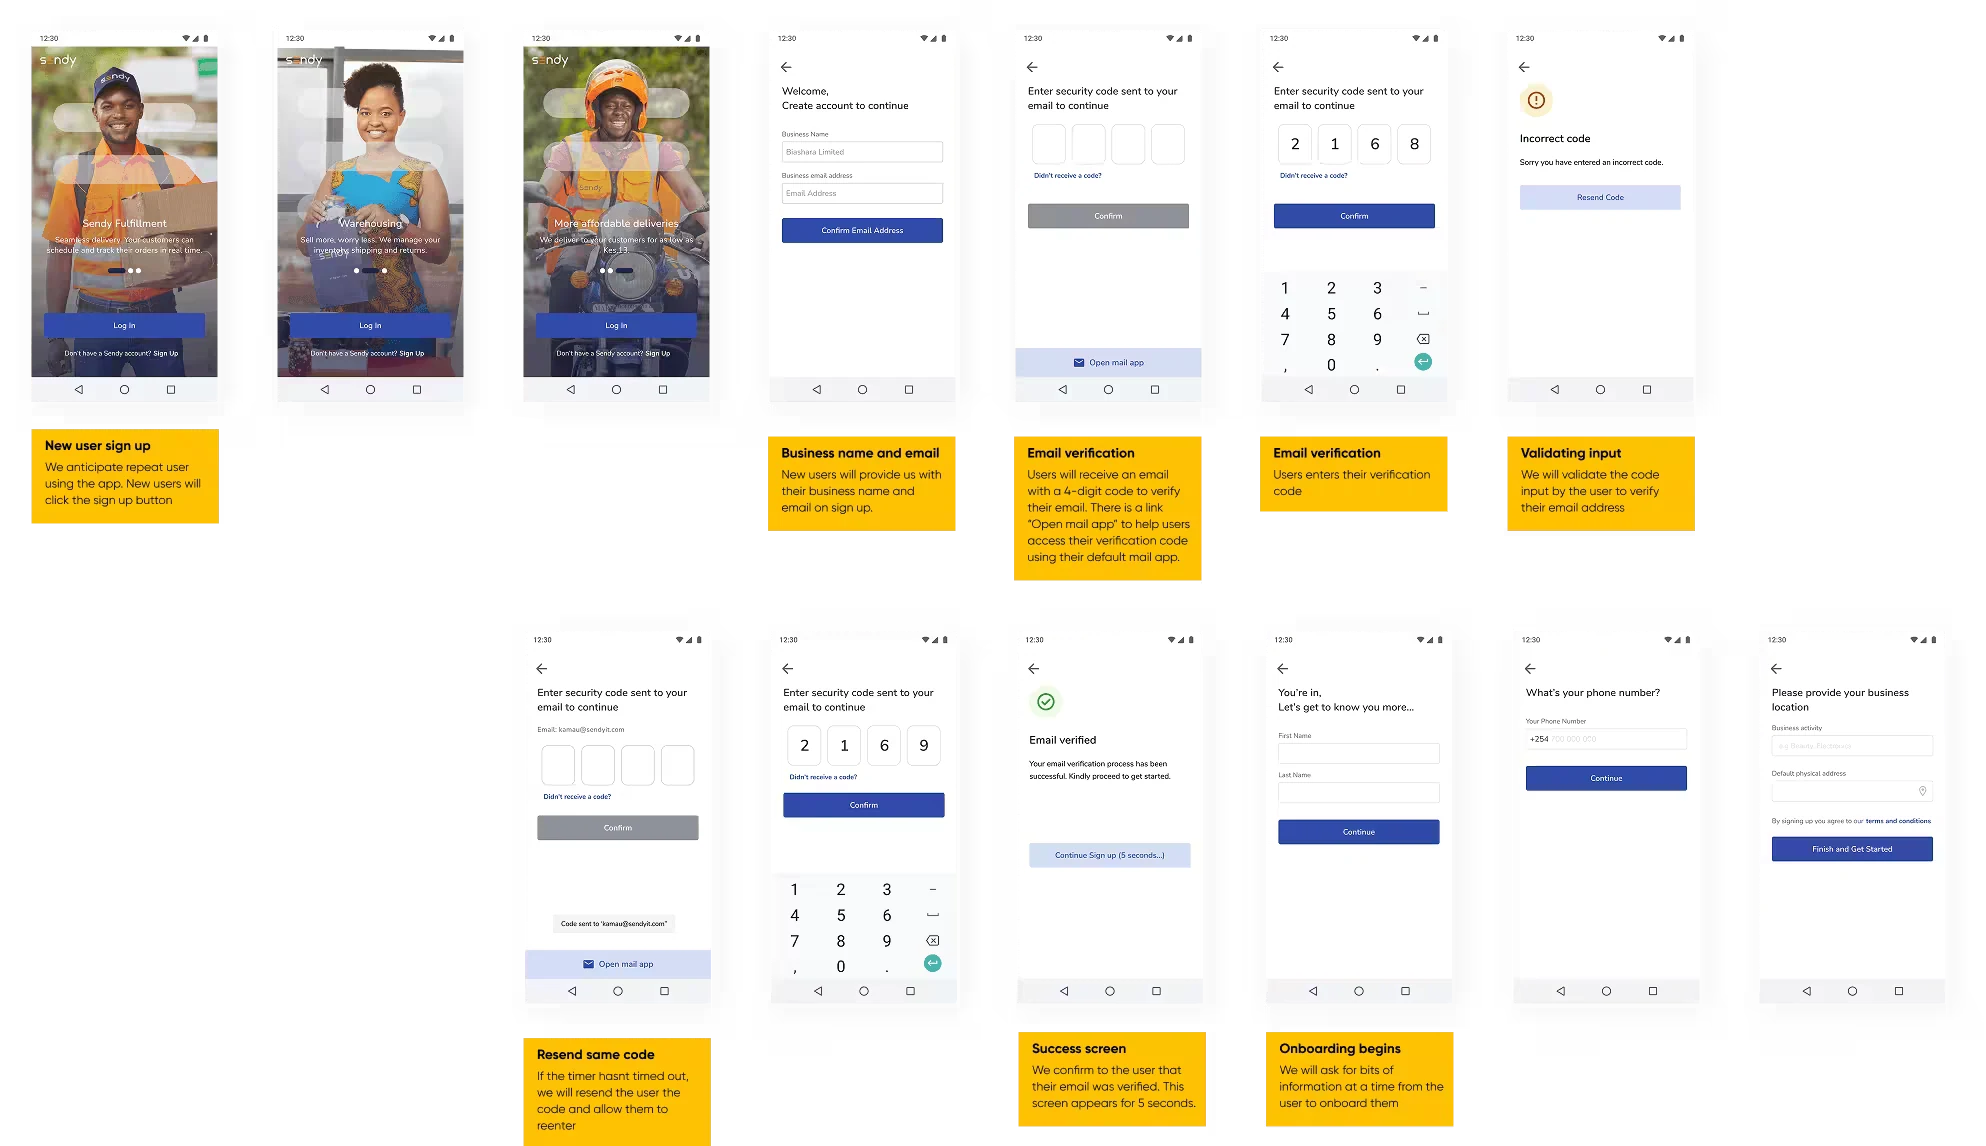
Onboarding process first educated sellers on the core value proposition and helped them gain trust of this unique complex logistics approach of acting as a trusted intermediary. Once sellers were convinced, they are required to update their personal and business information.
Send products to Sendy warehouse
Instead of sellers managing individual deliveries to multiple customers across the country, they sent their entire inventory batch to a single, secure Sendy warehouse. When an order was placed on the marketplace, Sendy's team would pick, pack, and dispatch the item directly from their warehouse using their own logistics network. The seller was completely abstracted from the fulfillment chaos.
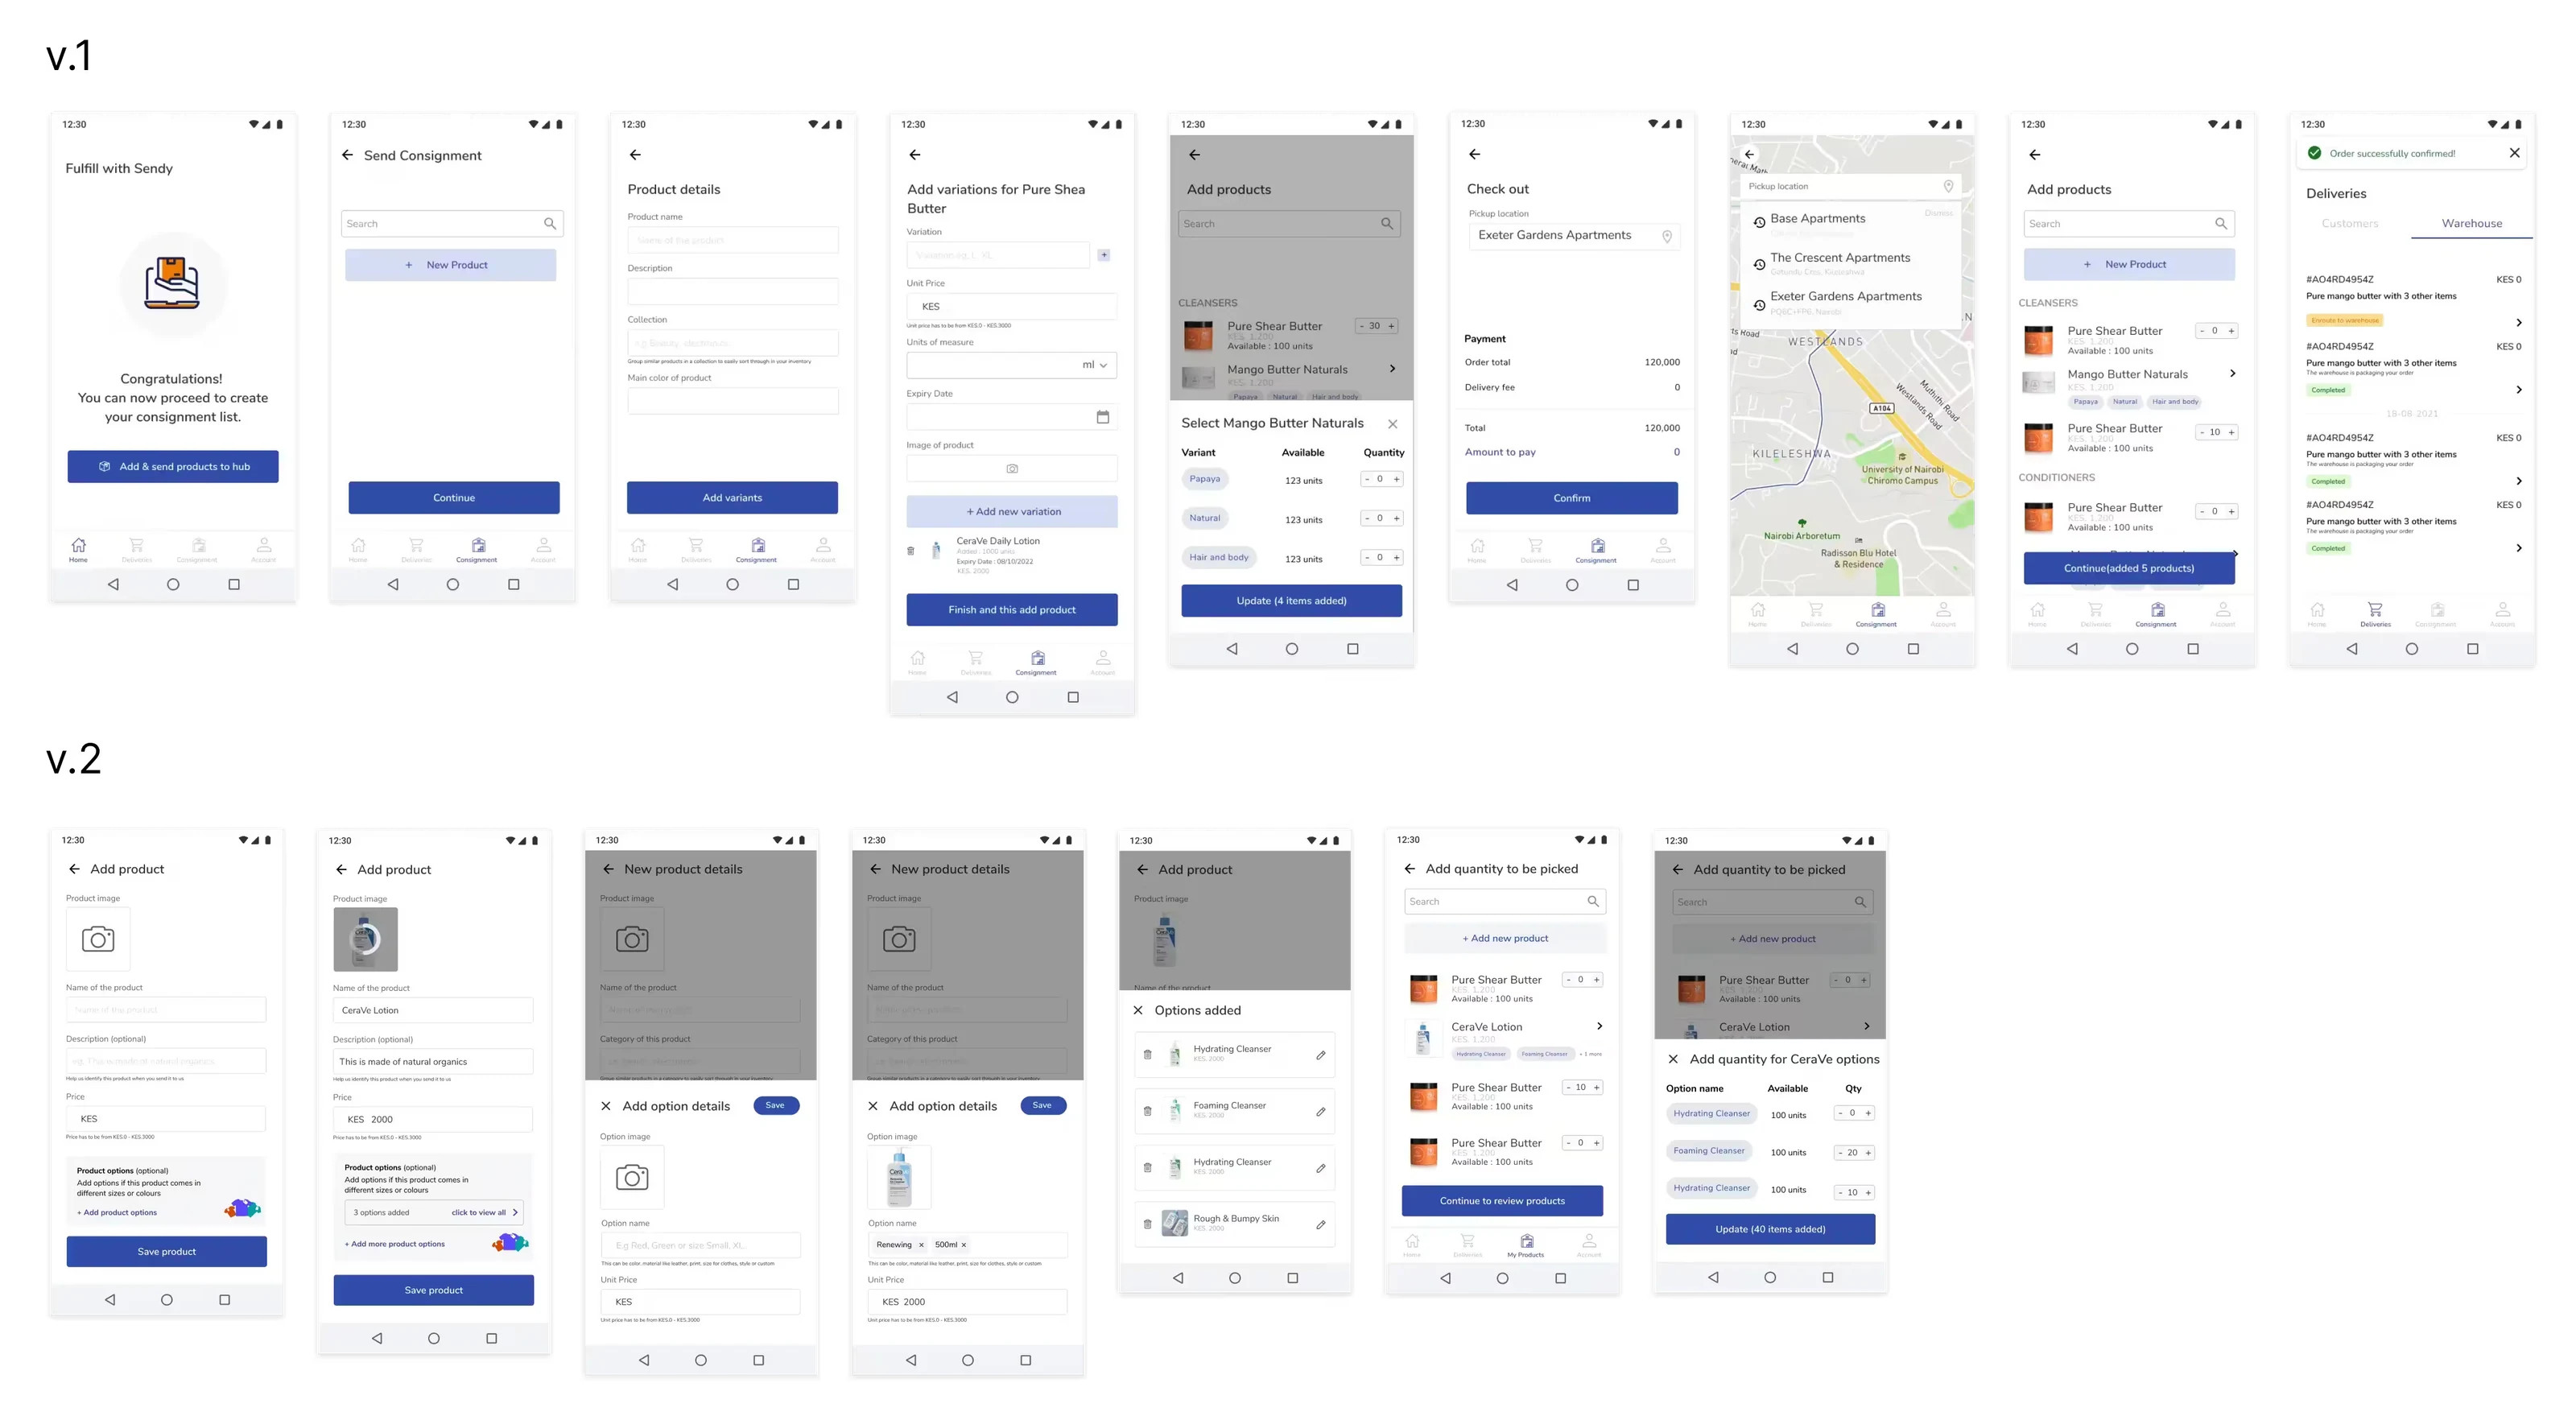
After the redesign...
Remote testing
With the prototype on Maze, I divided the user journey into individual tasks for our 10 participants to test. We observed the task completion rate, the time taken per task, and how easy or difficult users found each task. Within the flow, we also ran A/B tests on different concepts to see which ones users preferred.
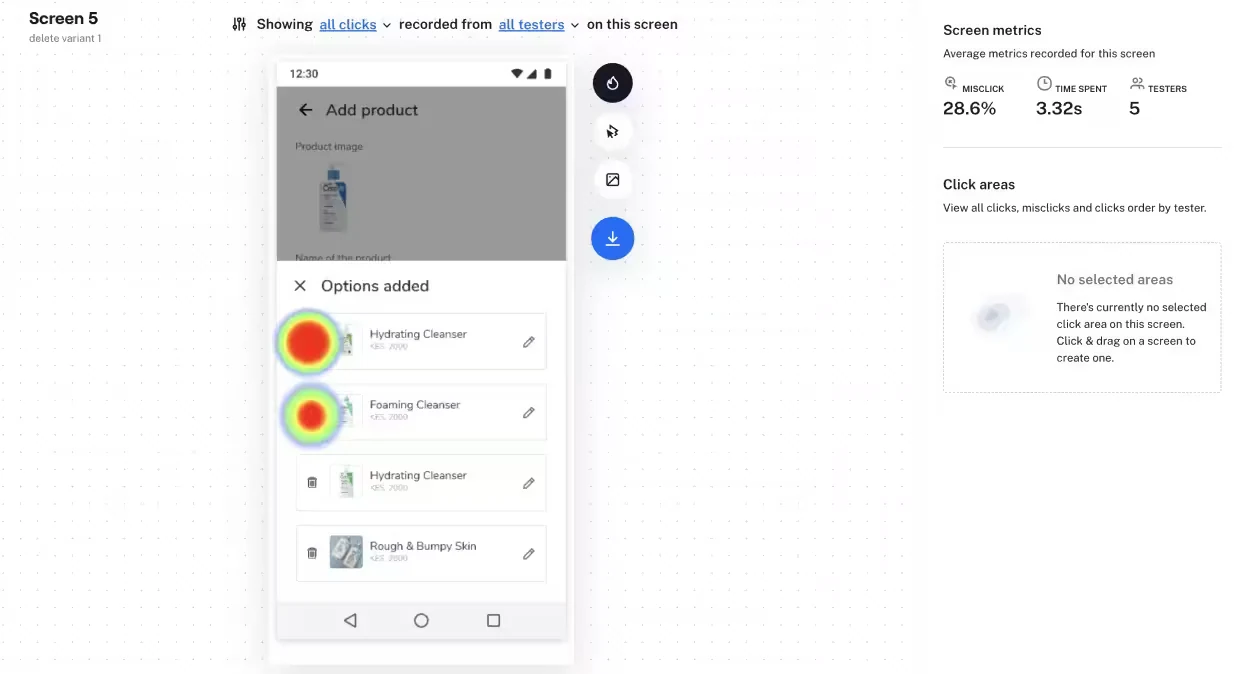
Task completion rate of 81%.
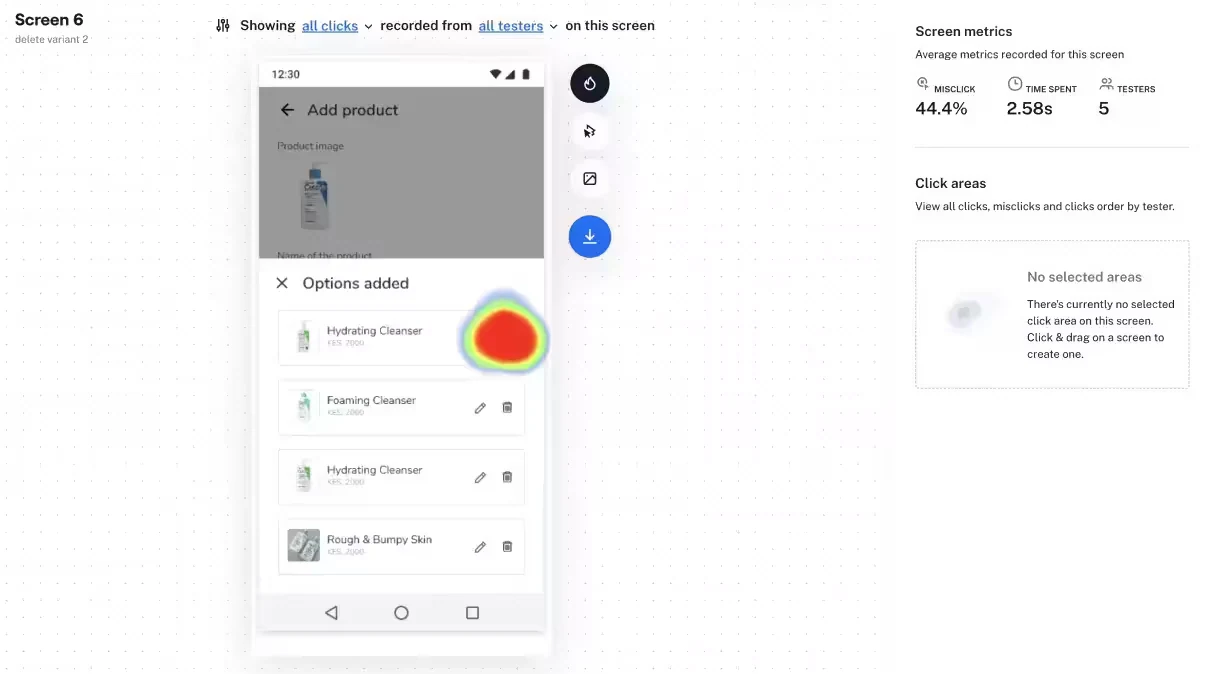
Task completion rate of 64%.
Piloting the MVP
We piloted the MVP with 10 businesses that gave us visibility of gaps that occured with the experience we had created, Beyond that;
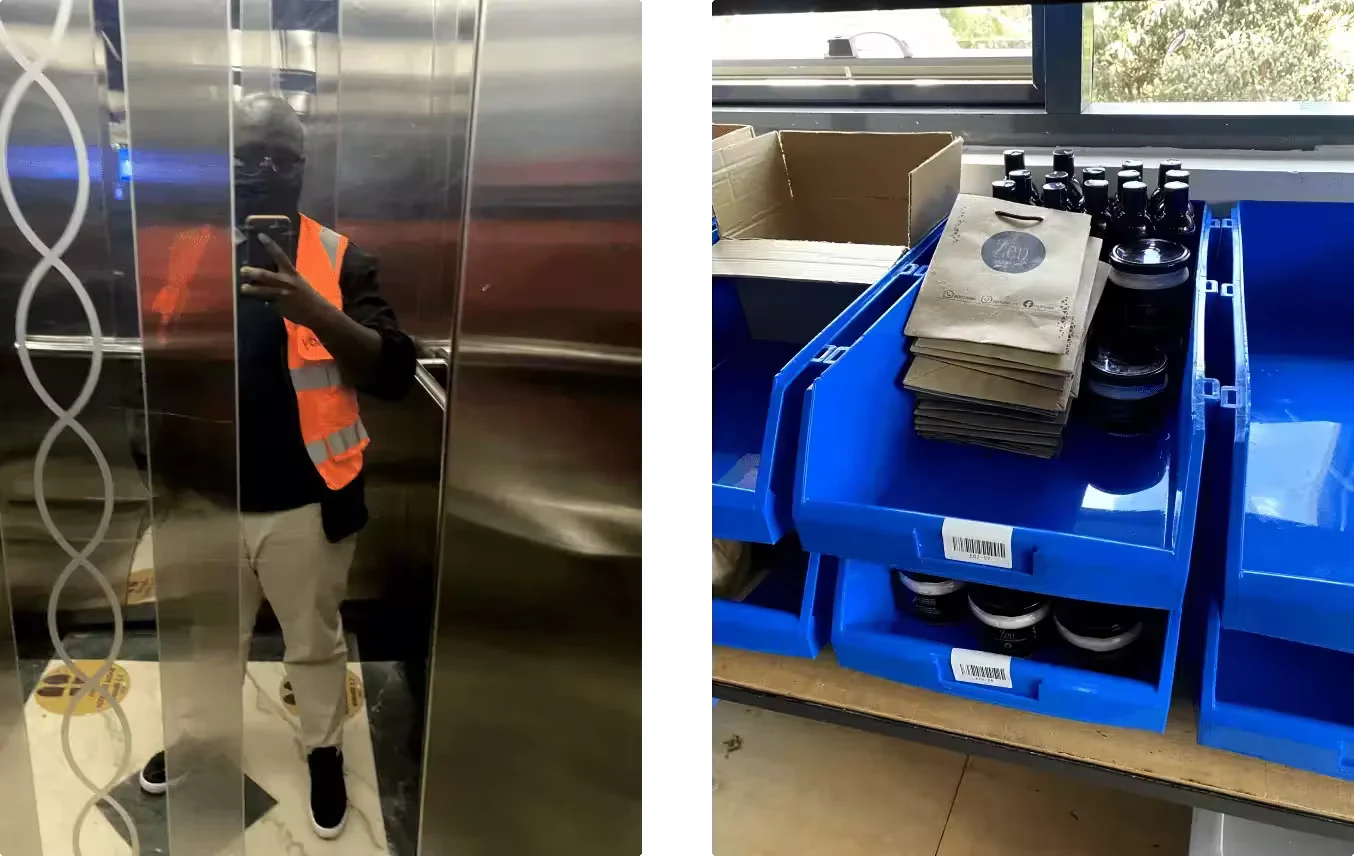
I did delivery runs to try identify gaps in the flow. For a day I got to deliver 7 out of 9 packages planned. So many things went wrong because of oversight.
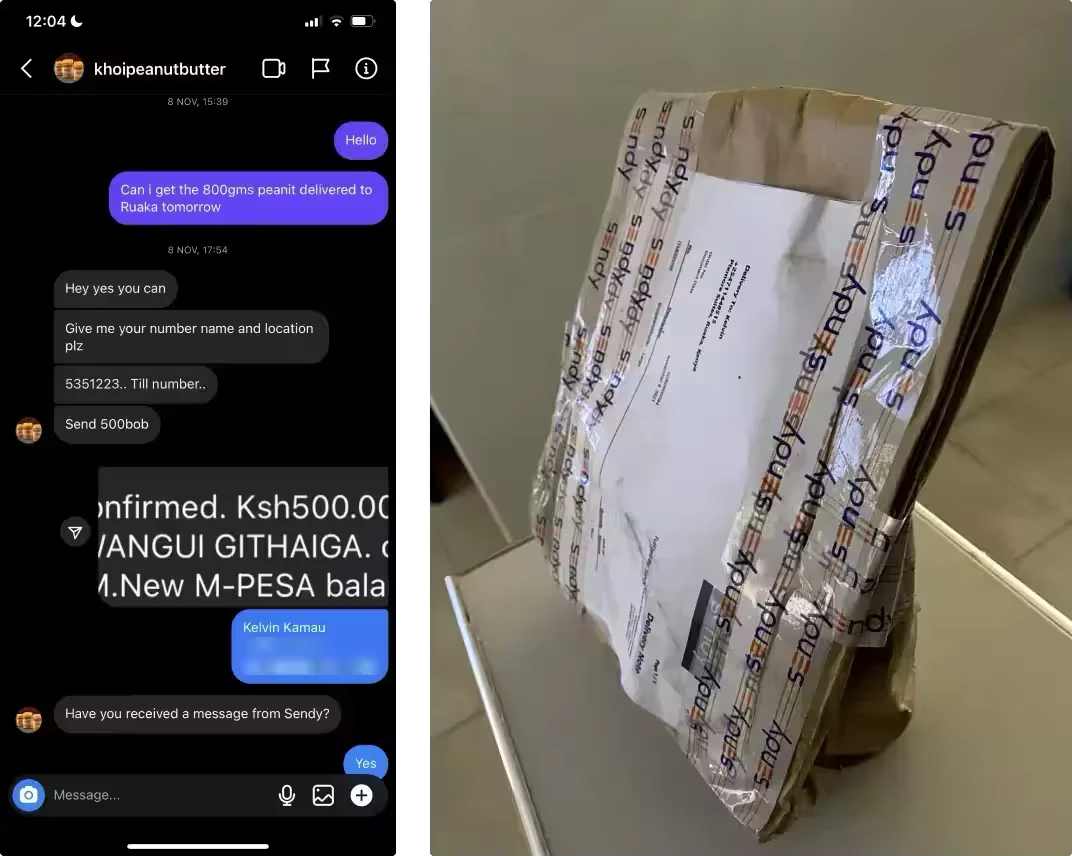
I then ordered and received a package from a vendor who was using the platform. This gave us visibility on the end customers’ experience. The tracking and communication did not go as anticipated and this was a great learning experience.
Measuring success
I worked within the growth pod and using the AAARRR metrics framework we built a funnels and using Metabase and Mixpanel data we tracked our customer’s lifecycle in order to ensure growth and success through improved conversion.
onboarded in the first 4 months of launch date.
successful and timely deliveries in first year of launch.
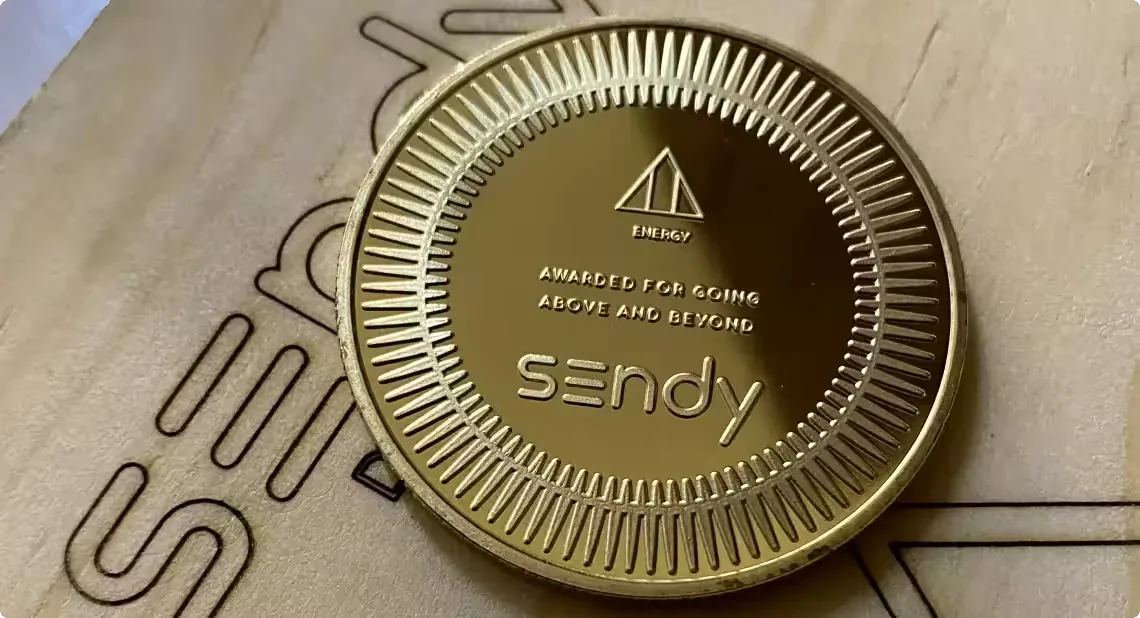
Awarded for going above and beyond.
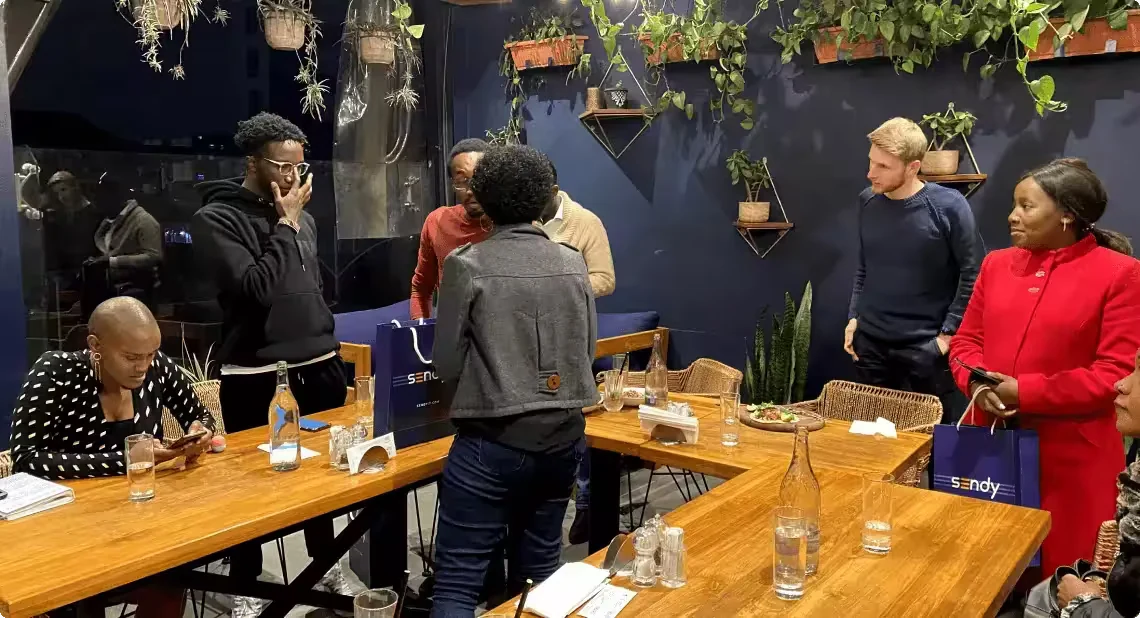
Celebrated with our early adopters